7-Day Fat Loss & Healthy Lifestyle Plan (With Printable PDF Diet & Activity Charts)
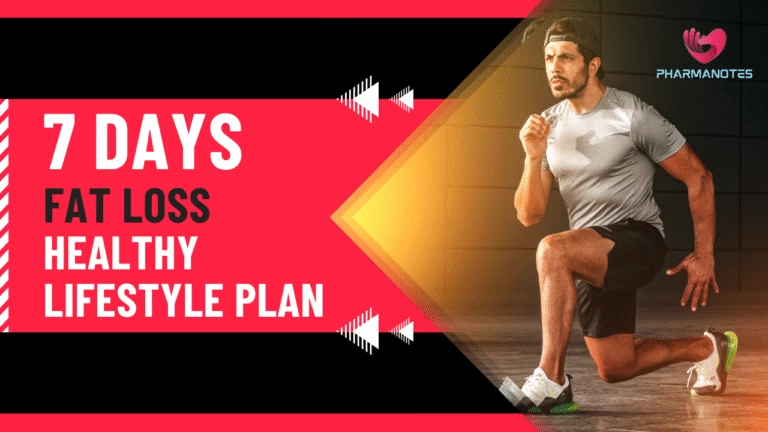
7-Day Fat Loss & Healthy Lifestyle Plan (With Printable PDF Diet & Activity Charts) Introduction If you’ve been searching for …
7-Day Fat Loss & Healthy Lifestyle Plan (With Printable PDF Diet & Activity Charts) Introduction If you’ve been searching for …
Best Pharmacist Exam Solved Papers & Practice Sets – Your Key to Success Best Pharmacist Exam Solved Papers & Practice …
Understanding Human Metapneumovirus (HMPV): A Comprehensive Guide Human Metapneumovirus (HMPV) is a respiratory virus that primarily affects the respiratory tract, …
Dispensing of Typical Prescriptions One Shot Notes and MCQs Principles Involved and Procedures Adopted in Dispensing of Typical Prescriptions 1. …
Prescription and Non-Prescription Products Prescription and non-prescription products 1. Prescription Products Prescription products, also known as Rx drugs, require a …
Pharmaceutical Acts with Latest Amendments One Shot Notes and MCQs A Brief Study of the Pharmaceutical Acts with Latest Amendments: …
Pharmaceutical Ethics and Related Acts One Shot Notes and MCQs Pharmaceutical Ethics Pharmaceutical ethics encompasses the moral principles that guide …
Pharmaceutical Legislations One Shot Notes and MCQs Pharmaceutical Legislations 1. Pharmaceutical Legislations: A Brief Review Pharmaceutical legislation ensures that drugs …

Antibiotics One Shot Notes and MCQs Antibiotics: Overview and Historical Development Antibiotics are compounds that inhibit the growth of or …

Genetic Recombination and Biotechnology Applications One Shot Notes and MCQs Genetic Recombination and Biotechnology Applications Genetic Recombination Genetic recombination is …